The unbalanced RBKC cabinet
The current RBKC cabinet is heavily unbalanced in favour of Chelsea. Although 80% of the population lives in Kensington, half of the 11 cabinet members represent its little kid sister Chelsea. If the cabinet was to reflect the spread of both the population and the councillors, 9 of them should come from Kensington wards.

This map shows how unbalanced the cabinet is. The figures show how many of the Conservative councillors in each ward sit in the cabinet, and the darker blue, the more of the councillors in a Conservative ward have been let into the cabinet. The seven light blue Conservative wards have no representative in the cabinet, and they are all in Kensington, while not one of the 3.5 Chelsea wards is unrepresented in the cabinet.
On 3 July, the Conservative majority in the RBKC council decided to put forward Elizabeth Campbell, a councillor representing the Royal Hospital ward in Chelsea since 2006 and a cabinet member since 2010, as new leader of the council after Nick Paget-Brown. She is to be formally elected at the full council meeting on Wednesday 19 July.
At the moment she is undoubtably selecting her cabinet, to be presented as soon as she has been formally elected. In our email to the Conservative majority, before they chose the new leader, we expressed the hope that they would choose “someone whose instinct will not be to close doors but to open them; someone who can engage with all sections of the local community.” This wish is equally true for Elizabeth Campbell’s selection of cabinet members.
A few facts:
RBKC has 18 wards and 50 councillors, whereof 14.5 wards and 39.5 councillors in Kensington and 3.5 wards and 10.5 councillors in Chelsea (as the Brompton and Hans Town ward is in both parts of the borough, following the merger of the Brompton and Hans Town wards in 2014).
This means that Kensington has 79% of the councillors and Chelsea has 21%, which also fairly well reflects the spread of the population: of the borough’s 156,644 residents (according to the 2011 census), 125,181 (80%) live in Kensington and 31,463 (20%) live in Chelsea.
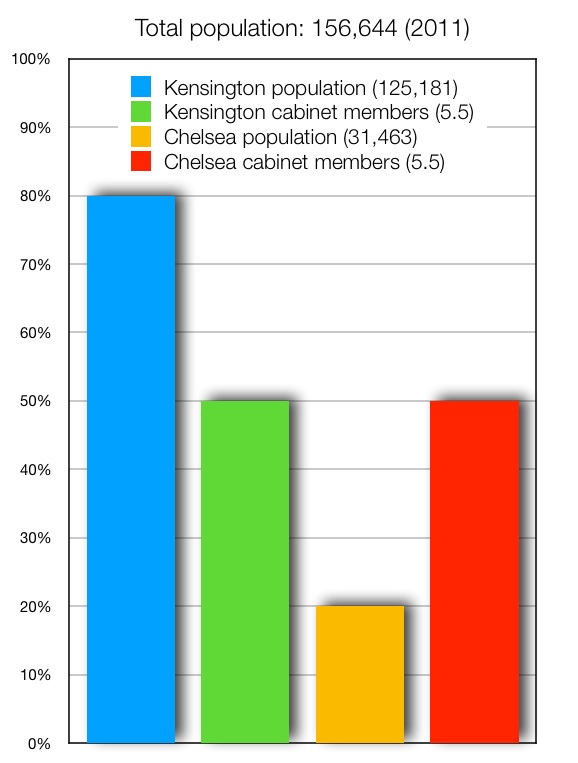
This table shows population versus representation in the cabinet. Kensington has 80% of the borough’s population, but only half of the cabinet seats.
However, of the 11 members in the current cabinet, 5.5 are from Chelsea wards and 5.5 from Kensington wards (all three councillors in the Brompton and Hans Town ward are cabinet members, but as that ward is in both Kensington and Chelsea, we have divided those three between the two parts).
If the cabinet is to reflected the spread of both the population and the councillors, 9 of the cabinet members should come from Kensington wards and only 2 from Chelsea wards. At the moment, 52% of the Chelsea councillors occupy cabinet posts, compared to only 19% of the Conservative councillors in Kensington.
Of the 50 councillors in the borough, 39 are Conservative, 11 Labour and 2 Lib Dem. Of the 39 Conservative councillors, almost 30 represent Kensington wards, so it should be possible to find the necessary 9 to make the cabinet more geographically representative. One of them even sits in the middle of the red north.
Can we hope for a cabinet which better reflects the fact that 80% of the population lives in Kensington?
Published 2017-07-15

